04 2023–2024
Mobile app for IoT device management
A greenhouse that waters itself. Design and build, and my bachelor thesis at the same time.
- Client
- Soleqa s.r.o.
- Period
- 2023–2024
- Role
- Design and development
- Stack
- React NativeTypeScriptGraphQLECharts
I did the design and the frontend. The Python backend and the device firmware were written by someone else; my part is the boxed one on the architecture diagram.
Context
An app in which the user manages IoT devices, meaning sensors and actuators, straight from a phone. The typical deployment is a greenhouse or a garden.
It began as my bachelor thesis at Brno University of Technology, but the brief and the requirements came from Soleqa, so it was never a project for the drawer. I defended it in June 2024.
The goal was to get four things into one app: real-time monitoring, comparison against historical data, manual control, and automation.
Problem
Every sensor could be a different device carrying a different set of readings. The interface could not assume a fixed set of values; it had to cope with whatever combination a device reported, on a small screen.
The user needs to configure when things switch themselves on, and to do it without programming.
And above all: two different rules can want opposite things from the same device. Watering should run when the soil is dry and stop when it is wet. The app has to know which one wins.
Decisions
- 01
Design the app, not just build it
I did the interface design myself, including how the condition system is operated. On a product where a non-technical user configures automation, the design is the hard part.
- 02
History as part of the overview
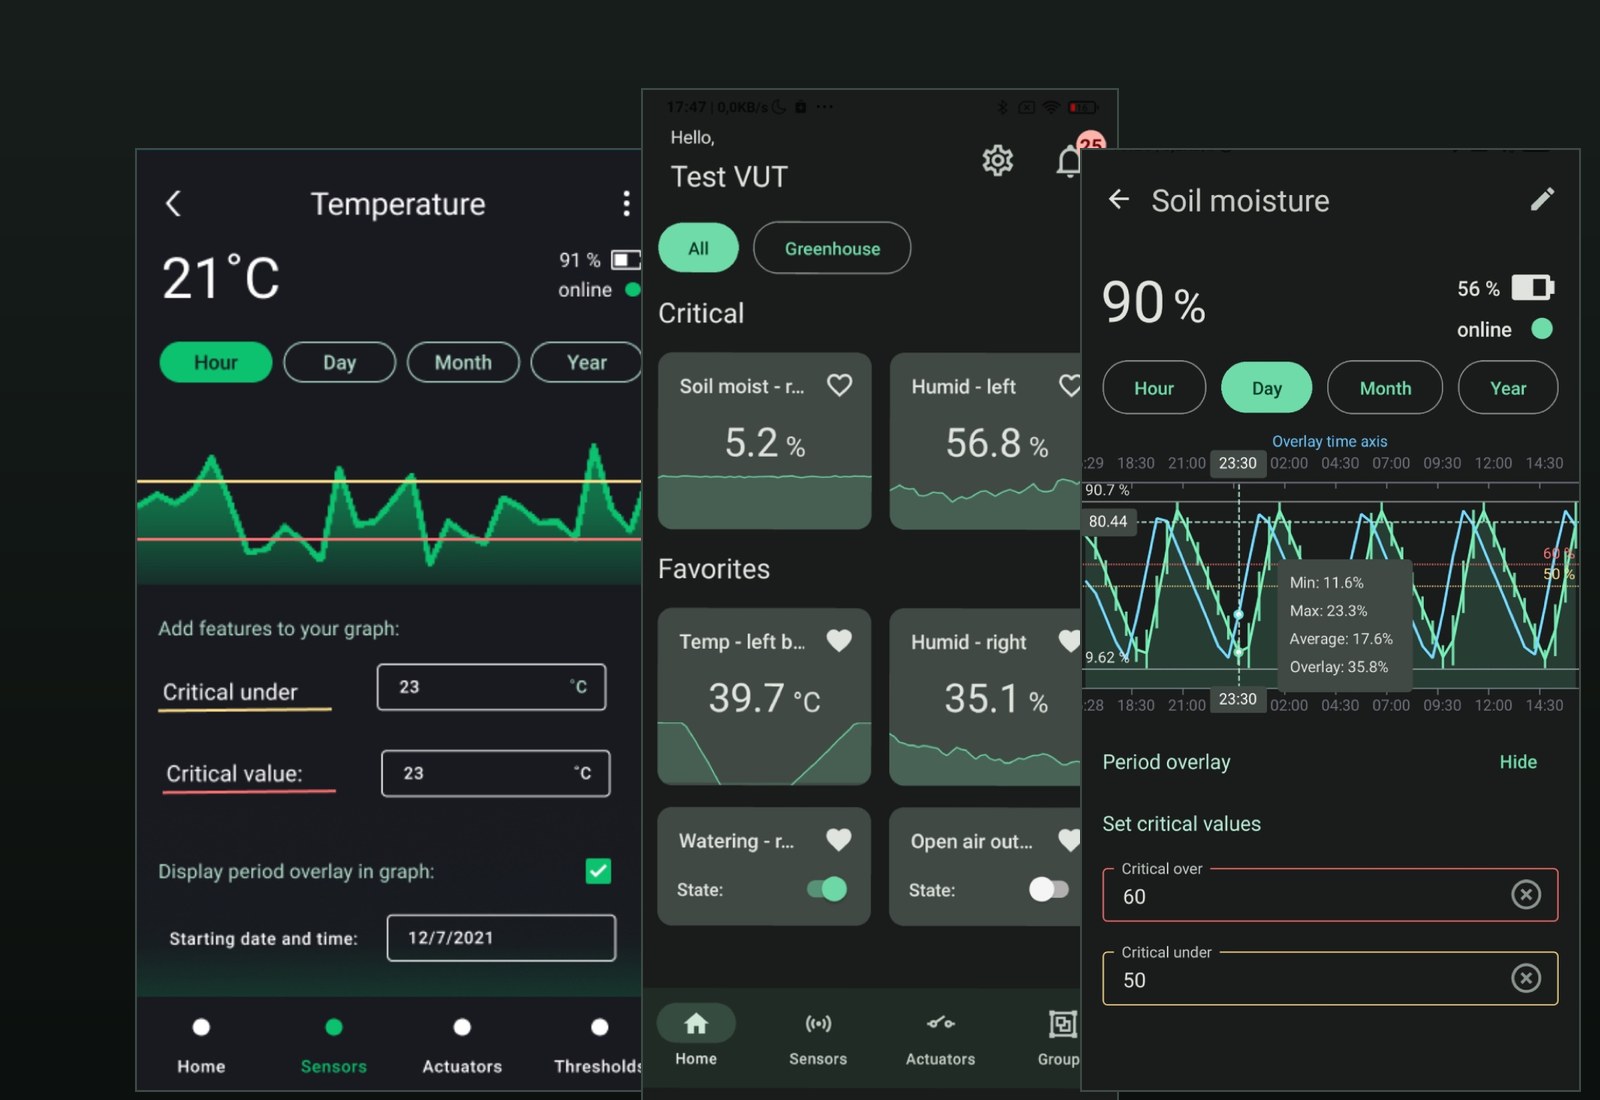
The chart switches between hour, day, month and year, reads out minimum, maximum and average, and can overlay two periods on top of each other so today can be compared with last week. The overlay range is derived from the selected period. Without comparison over time, a current reading is just a number.
- 03
Critical values drawn on the chart
The user sets an upper and lower critical threshold per sensor and each is drawn as a line across the chart. A breach is then visible at a glance, without reading any numbers.
- 04
A condition system built from groups
Automation is assembled from groups: a group holds conditions (sensor, operator, value) and the list of actuators to switch when they are met. The user builds a rule by tapping rather than by writing logic.
- 05
Show what is wrong before the user goes looking
The home screen puts sensors in a critical state at the top and favourites below them. Notifications go further than “an actuator changed”: they name the group that changed it. With automation, the worst feeling is something happening and not knowing why.
- 06
Priority as conflict resolution
The hardest decision in the whole project. When several groups reach for the same actuator, priority decides, and assigning a priority automatically renumbers the others so the ordering stays consistent. Manual control overrides everything.
My role
- The interface design and the entire React Native and TypeScript frontend.
- Backend integration over GraphQL, charts built on ECharts.
- Internal testing through the Google Play Console.
Visuals
-
Architecture of the whole system. My part is the frontend, the boxed one.
-
Home screen: critical readings first, favourites below
-
Critical thresholds on the chart and a two-period overlay
-
Condition groups and conflicts resolved by priority
-
Notifications name the group that switched a device, plus the groups overview
Result
- An app in which a non-technical user can set up automation for their own greenhouse.
- A bachelor thesis defended in June 2024 at Brno University of Technology.
- For me, the first real lesson that interface design matters as much as the code underneath it.